
How to Win the US Powerball According to Maths
Many US Powerball players are wasting money and time on their favourite hot numbers, birth dates, anniversaries, horoscope lucky numbers and many other unscientific lottery strategies.
The fact remains that you are not winning the US Powerball jackpot because you keep on playing the wrong combination of numbers.
The classic 1-2-3-4-5 lottery combination is so well known that many try to avoid it. Still, mathematically speaking, millions of similar patterns exist within the universe of Powerball’s 292 million combinations.
Many lottery players are not aware of the many number combinations that will not occur in thousands of draws. For example, this may be happening if you have been using the quick pick option to select your US Powerball lucky numbers.
THE ODDS OF WINNING THE US POWERBALL
The US Powerball has a 5/69 lottery format. So, the rule is to pick five numbers from 1 to 69. There are 11 million potential ways you can do it; thus, your probability of matching five numbers is 1 in 11 million chances.
However, to win the jackpot, you also need to match the extra ball called the Powerball from 1 to 26. This changes your odds of winning the jackpot to 1 in 292 million. So, if you play one ticket every week, then you need 292 million weeks to win. The odds are so terrible that you probably have a better chance of becoming the next President.
It is therefore clear; it is not easy to win the US Powerball jackpot but it is worth ensuring you have an entry as you can never win if you not in it!
That said, mathematics remains the only way to get the best shot possible. The US Powerball, like any other lottery systems in the world, is a random game. So, you cannot predict the next winning numbers. Fortunately, you can improve your probability of winning if you know how to use a lottery wheel properly in combination with number patterns.
These two mathematical tools are essential in the study of number patterns that can help determine the best combinations to play and the worst ones to avoid at all costs.
Before we go to the advanced patterns, let’s start with the simple pattern first.
The Power of Combinatorial Patterns in The US Powerball
In the lottery, one of the key factors to consider is to know the make-up of your combination. This table shows the complete odd-even patterns in the US Powerball with their corresponding probability:
|
Patterns |
Combinations |
Probability |
|
3-odd-2-even |
3671745 |
0.326710926970499 |
|
2-odd-3-even |
3560480 |
0.31681059585018 |
|
4-odd-1-even |
1780240 |
0.15840529792509 |
|
1-odd-4-even |
1623160 |
0.144428359872876 |
|
5-odd-0-even |
324632 |
0.0288856719745753 |
|
0-odd-5-even |
278256 |
0.0247591474067788 |
|
11,238,513 |
1 |
These odd and even number patterns can be divided further into three groups:
|
Best Patterns |
Fair Patterns |
Bad Patterns |
|
3-odd-2-even |
4-odd-1-even |
All-even-numbers |
|
2-odd-3-even |
1-odd-4-even |
All-odd-numbers |
The table above shows that the best patterns to play in US Powerball are a balanced mix of odd and even numbers. Similarly, we can do the same combinatorial analysis for low and high numbers.
Below is how we group the low-high patterns based on their probability:
|
Best Patterns |
Fair Patterns |
Bad Patterns |
|
3-low-2-high |
4-low-1-high |
All-high-numbers |
|
2-low-3-high |
1-low-4-high |
All-low-numbers |
Based on the table above, the majority of the winning numbers in the US Powerball lottery system are composed of balanced low and high numbers. So, to get the most out of your money, avoid numbers like 1-2-3-4-5 (all low numbers) or 65-66-67-68-69 (all high numbers).
Below is actual proof when you compare these theories with the actual US Powerball results.
Theoretical Prediction vs The Actual Results of The U.S. Powerball (Odd-Even pattern analysis as of February 05, 2020)
Expected Frequency = Probability X number of draws
There are 449 draws in the US Powerball from October 7, 2015, to February 05, 2020. So, in the case of a 3-odd-2-even pattern, we get 146.69320621 by multiplying 0.326710926970499 by 449.
We round off the number to arrive at 147. Now we see that the 3-odd-2-even pattern is expected to occur about 147 times in 449 draws.
Doing similar computation with the rest of the odd-even patterns, we will come up with the following complete comparison table below:
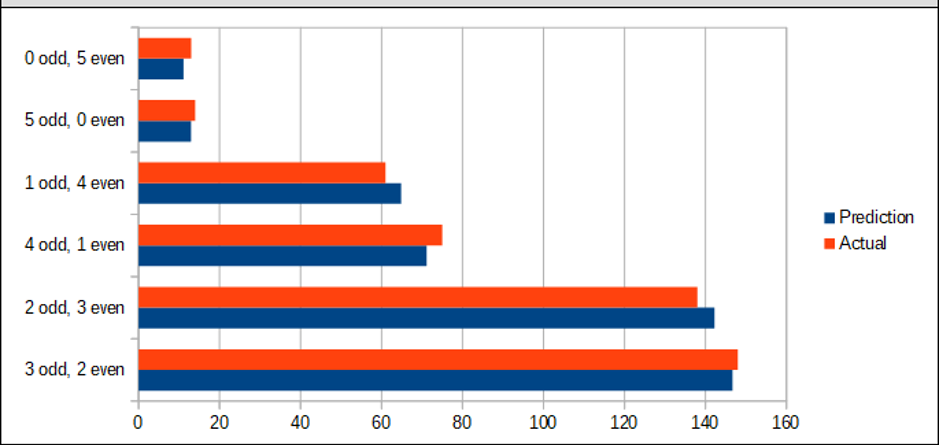
Looking at the table, the close value between expected frequency and actual frequency proves that the US Powerball behaves in a predictable pattern.
Fortunately for you as a lottery player, you can take advantage of this probability principle to get the best shot possible. By using maths and the probability formula, you can predict how specific number combinations will likely occur in a lottery draw.
For example, probability calculation shows that a 3-odd-2-even pattern is expected to appear 147 times. In the actual draw, the same pattern occurred 148 times. Very close prediction.
If you look at the whole graph, it does not take a second to realize that prediction and actual results strongly agree together. As a US Powerball player, you may want to put your money on the best two patterns and as a smart player, you don’t want to waste your money on all-even-numbers or all-odd-numbers!
Ultimately, Powerball players must play with a lottery strategy, focus on the best patterns, and avoid the worst ones but always ensure that you have entered!
Has this blog post got you thinking?
Enter the US Powerball draw now and select your new ‘Lucky Numbers’ >> https://www.firstworldlottos.com/#/home
SELECT THEM NOW